Retail video analytics: turning your cameras into answers
Contents
- What video analytics and computer vision mean, in plain English
- The metrics you get from video analytics
- Where it's used, by sector
- Shops and supermarkets
- Shopping centres
- Warehouses and logistics
- Restaurants, cafés and hotels
- Banks, clinics and public offices
- Access-controlled sites
- CCTV vs video analytics: the difference
- Rolling out video analytics: the steps
- When you need a bespoke build
- A ready-made platform from the group: Neurosensor
You already have cameras. In the shop, in the warehouse, in the shopping centre, on a site with access control. They record hours of footage that nobody watches until something goes wrong. Meanwhile the questions that really matter to the business go unanswered: why is Saturday heaving but the takings are ordinary? Where on the floor do people turn round and walk out? Why does the till queue put off half your customers at peak time?
Recorded video answers none of this. Retail video analytics does: the same cameras stop simply storing a picture and start counting, comparing and prompting an action. Below we explain it without the jargon: what video analytics and computer vision actually are, which numbers they give you, where they work across sectors, and how to run them on the cameras you already have.
What video analytics and computer vision mean, in plain English
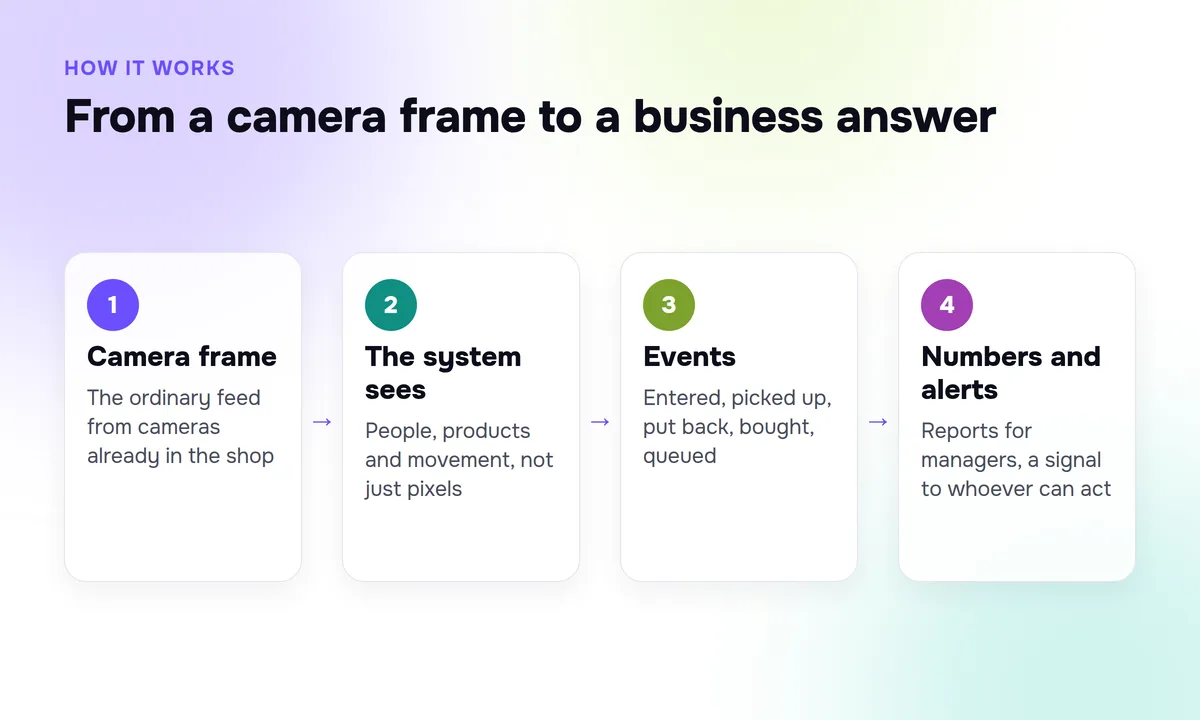
Computer vision is a programme's ability to "read" an image: to recognise people, products, movement and events in a video, not just pixels. Video analytics is the applied use of computer vision on your cameras: the system watches the feed and turns what it sees into clear metrics and signals.
The difference from ordinary CCTV is simple. A standard system answers the question "what was recorded?", and only once someone sits down to review the archive. Video analytics answers "what is happening right now, and what should we do about it?" automatically and in real time.
One important point: this usually needs no new kit. Most modern CCTV systems are a good fit, and sometimes you only need to change a camera's angle or position. A short technical audit at the start shows exactly what works.
The metrics you get from video analytics
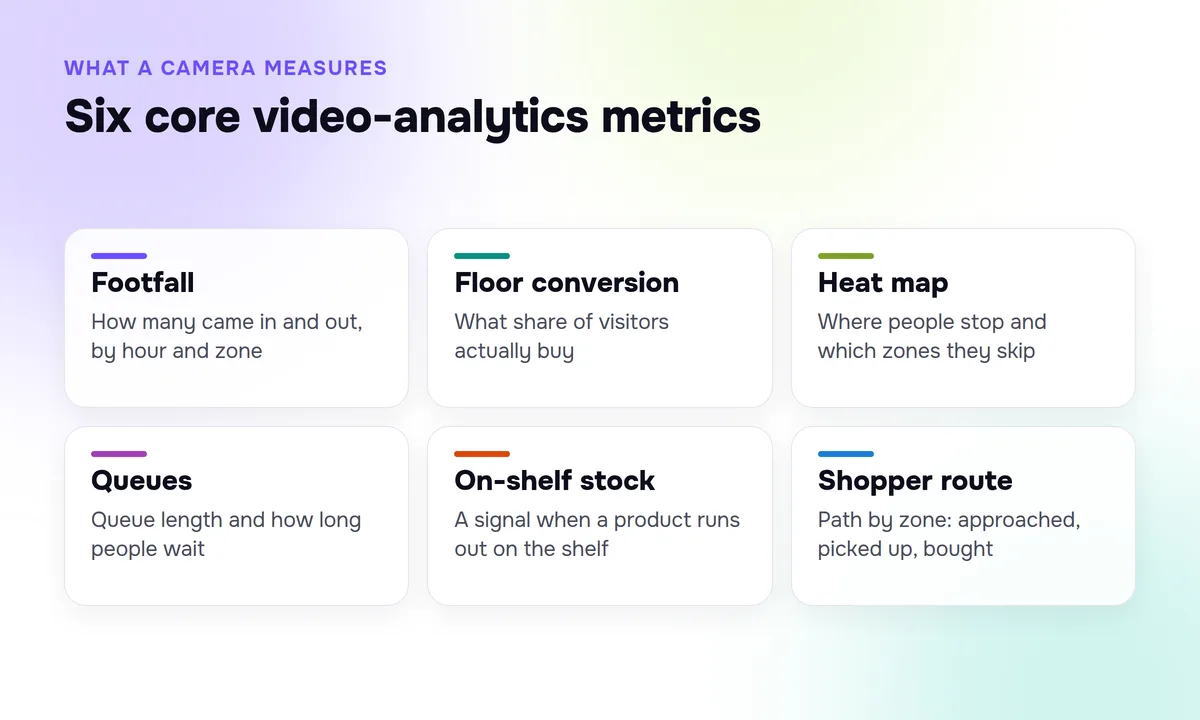
This is the main reason organisations adopt it: hard numbers instead of impressions from a walk round the floor. Here is the basic set of measures computer vision pulls out of video:
- Footfall (visitor counting). How many people came in, went out and are inside, broken down by hour, day, zone and individual site in the chain.
- Floor conversion. The share of visitors who actually buy something. Footfall becomes the denominator instead of a vague "it was busy".
- Heat maps and routes. Where people stop, which aisles they walk, which zones they avoid, how long they spend by a particular shelf.
- Product interaction. The path to purchase by zone: approached, picked up, put back, bought. You see what gets handled but never reaches the till.
- On-shelf availability. A signal when a product has run out on the shelf, even if your records still show it in stock.
- Queues and wait time. Queue length and how long a person stands in it, with an alert once the threshold is passed.
- Staff allocation. Where and when people are really needed, so shifts are planned against actual footfall rather than guesswork.
Each measure is not a report for the sake of a report; it answers a specific question the owner has. Below you can see which question each one closes.
Where it's used, by sector
Video analytics is useful first of all in retail, but it works anywhere a particular person needs to notice something important on the floor or on site.
Shops and supermarkets
Footfall and conversion show how well the floor turns traffic into sales. Heat maps suggest where to move the promo zone. On-shelf availability catches the "it's in the records but not in front of the customer" situation. Till queue analysis keeps you from losing people at peak time.
Shopping centres
Flow between floors and entrances, popular and "dead" zones, load by hour. These are arguments for rental rates, for planning events and for reorganising wayfinding.
Warehouses and logistics
Checks on personal protective equipment (helmets, hi-vis vests, footwear), aisles that are occupied or blocked, staff present at their assigned posts. An incident is logged with a video clip and a timestamp, which is a stronger record than a verbal report.
Restaurants, cafés and hotels
The system sees when a guest has left and starts the countdown to clearing the table. In hotels it spots a spilled liquid, a left item or a propped-open door in a corridor within minutes, rather than at the next walkabout.
Banks, clinics and public offices
The main headache for these places is queues. Video analytics counts people in the queue, measures the wait and raises a signal before a complaint appears.
Access-controlled sites
Entry into a restricted area, a blocked passage, a person appearing where they should not be. The signal goes to the responsible person at once, instead of being found after the fact in the archive.
CCTV vs video analytics: the difference
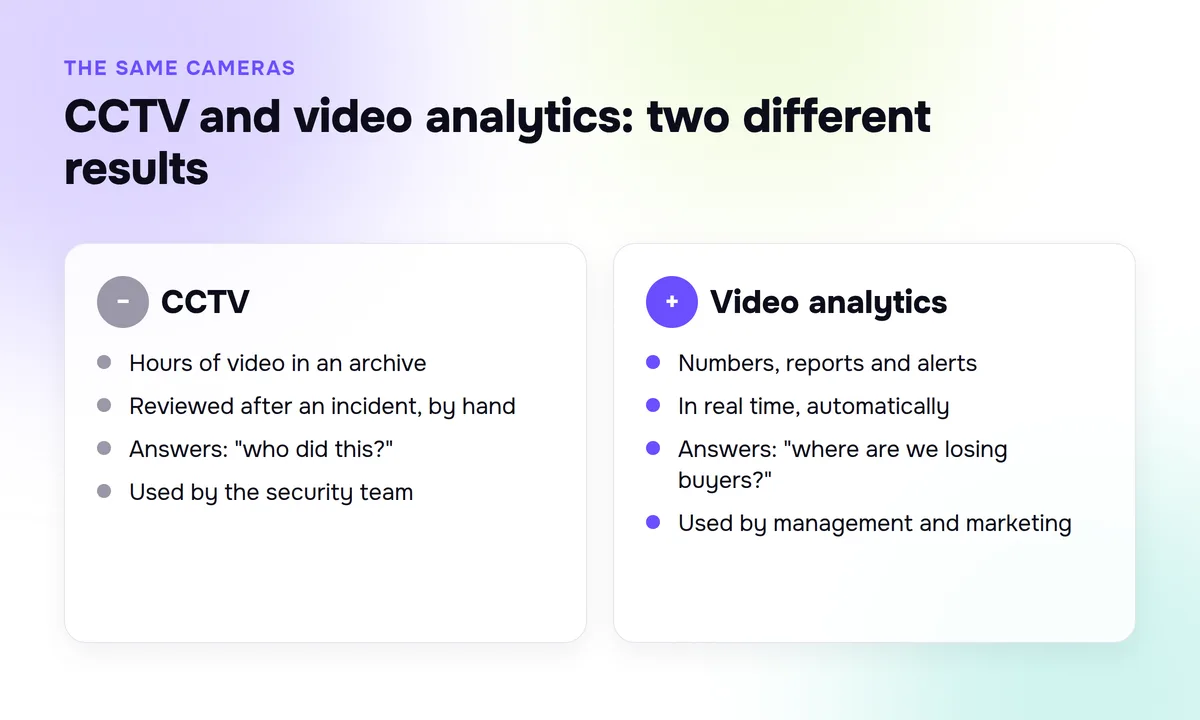
To avoid mixing the two up, let's compare them directly:
| Parameter | Ordinary CCTV | Video analytics |
|---|---|---|
| Purpose | Record what happened | Understand what is happening and prompt an action |
| When it's viewed | After an incident, manually | In real time, automatically |
| Output | Hours of video in an archive | Numbers, alerts, reports |
| Who works with it | Security team | Director, marketing, operations |
| Typical question | "Who did this?" | "Where are we losing customers, and how many?" |
And here is the reverse view, from a business question to the measure that answers it:
| Owner's question | Which metric answers it |
|---|---|
| How many people actually come in? | Footfall |
| What share of visitors buy? | Floor conversion |
| Which zones work and which sit empty? | Heat maps and routes |
| Why does the queue put people off? | Queue length and wait time |
| In the records but not on the shelf? | On-shelf availability |
| Are staff where they're needed? | Staff allocation by footfall |
Rolling out video analytics: the steps
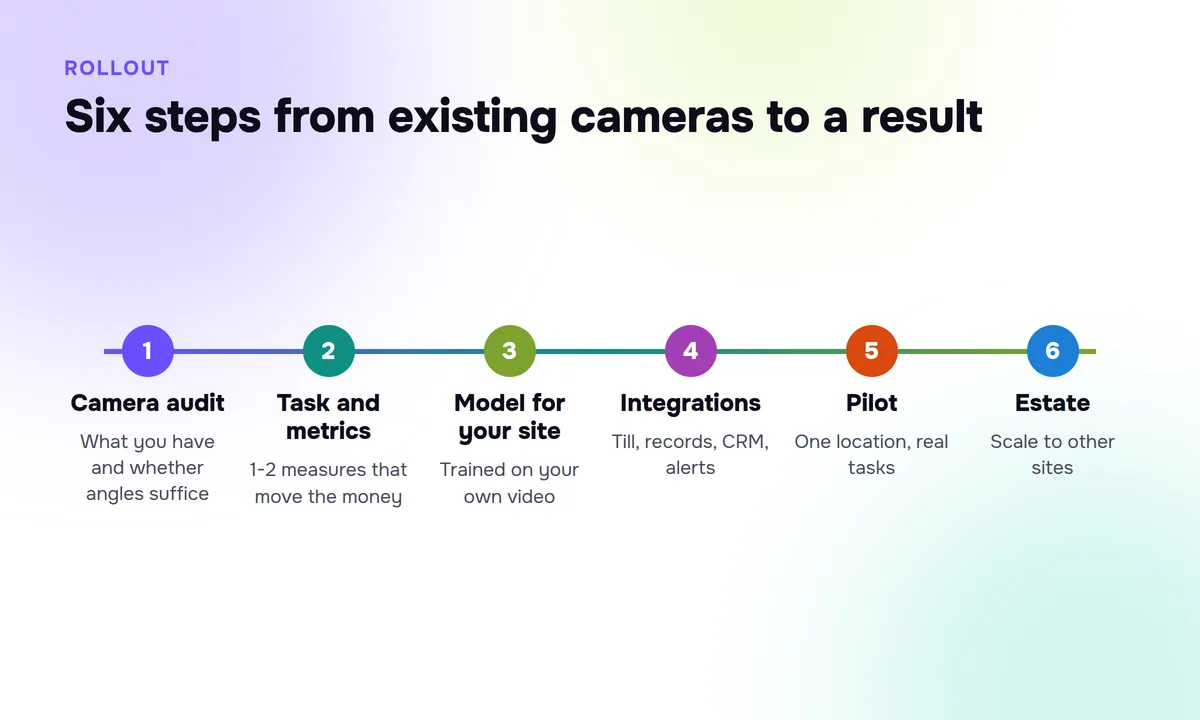
You don't launch video analytics "everywhere, all at once". The right path is to start with one site and one or two measures that really move the money.
- Technical camera audit. We look at what you already have and whether the angles are enough. Most of the time no new kit is needed, except perhaps changing a camera's angle or position somewhere.
- Defining the task and metrics. We choose what exactly to count: conversion, queues, on-shelf availability. One clear task delivers a result faster than a dozen at once.
- Tuning the model to your site. The model learns on your video, your cameras, your lighting and your product range, instead of being taken "off the shelf" and forced to fit.
- Integrations. To link what is seen to money, the system is connected to the till (POS), your records, CRM or ERP, and alerts go to a channel the team already checks.
- Pilot at one site. We launch at a single location and watch the result on real tasks, not in a presentation.
- Rolling out to the estate. Once the pilot shows an effect, we deploy the solution to other sites on the same cameras.
When you need a bespoke build
Ready-made measures cover the typical needs. But as soon as the task becomes specific, you need a solution built for you, and this is where Neurotrack comes in. We develop our own computer vision solutions and integrate them with your systems, so that video turns not into one more dashboard but into an action inside your processes.
- Bespoke CV scenarios. If an event can be described in words, "this is fine", "this is not", a model can be trained to recognise it. One example from our work is video analytics on a construction site: monitoring processes and safety where an ordinary camera only records an archive.
- Integrations with your records and CRM. Without a link to your systems, the numbers stay a picture. We build CRM and ERP integrations so data from the cameras lands where you already work.
- Reports and analytics. Raw measures need to be brought into a clear picture for a manager. That is the analytics and reporting area; for how it looks in practice, see the automated reports case.
A ready-made platform from the group: Neurosensor
If the need is typical, retail, queues, floor analytics, you don't always have to build a solution from scratch. Within our group there is a dedicated platform for this: computer vision from Neurosensor. It is one platform on your cameras that links what visitors do, the product disappearing from the shelf, and what people actually paid for.
Neurosensor works in three scenarios on a single tracking layer:
- Autonomous shop. The shopper takes what they need and walks out; the system records every pick-up and put-back and closes the sale with no checkout and no scanning.
- Store management. While the shop is trading, the system watches shelf availability, queues and staff allocation, and sends a signal to whoever can put things right.
- Space and sales analytics. Footfall, heat maps, product interaction and the performance of every square metre; more on the space and sales analytics page.
The main advantage of this format is that you don't need to build your own team for a computer vision project: the platform and the models are already on the developer's side, and they start from the cameras you have.
For formats with no staff, autonomous points and vending, the group has a separate line, Neuroshop, which makes operational technology for chain businesses.
Want to understand what your cameras can already show and where to start? Request a free consultation and we'll look at your site and suggest which measures will deliver a result the fastest.
FAQ
Do I need to buy new cameras for video analytics?
For space analytics and store management, usually no. Most modern CCTV systems work without replacing the kit; sometimes you only need to change a camera's angle or position. The exact answer comes from a technical audit at the start. The exception is the autonomous shop scenario: that needs denser coverage from above, so extra cameras are the norm.
How is video analytics different from ordinary CCTV?
Ordinary CCTV records video so you can look later at what happened. Video analytics analyses the same feed in real time and turns it into numbers, alerts and reports: how many people came in, where they walk, where a queue builds, what has run out on the shelf. The first answers "who did this?", the second answers "where is the business losing money, and what do we do about it?".
Which measures can I get from cameras?
The basic set: footfall, floor conversion, heat maps and routes, product interaction by zone, on-shelf availability, queue length and wait time, staff allocation by actual footfall. Some of these, for example the "picked-up product → purchase" link or revenue per square metre, are counted together with your till data.
Why connect video analytics to the till and CRM?
A camera sees behaviour but not money. To match footfall with takings, and a picked-up product with a real purchase, the system is integrated with the till (POS), your records and CRM. Without those integrations you get customer behaviour; with them you get the link between behaviour and sales.
Does video analytics suit a small business with a single shop?
Yes. The right start is exactly that, a pilot at one site and one or two measures that matter most to the result. If the pilot delivers, the solution scales to other locations on the same cameras, without a separate project each time.